Data Analysis: WFC Summary – 12.12.2018

Data Analysis: WFC Summary
This article aims to reflect at the 2018 World Floorball Championships in Prague through data tracked. There is a look on overall data in the first part (Corsi and PDO) followed by more detailed look using possessions-based data. These were tracked only for selected 15 games (out of all 24 games of top 8 teams). You can find interesting findings about the game itself. Also about how dangerous are different types of possessions and specific numbers for each team. Lastly players results are studied.
Finnish defence and goalkeeping always there to help
For tournament overview we look at two basic metrics - Corsi and PDO (pre-tournament article).
Corsi = shot attempts differential (Corsi For% = share of shot attempts for from all shot attempts)
PDO = shooting percentage plus goalkeepers save percentage
Both metrics correlated with final standings nicely (value of -1 would mean perfect correlation):
-0.88 Standings and Corsi For%
-0.81 Standings and PDO

PDO chart above brings a look on both shooting and goalkeeping efficiency for teams in the tournament. We can see all three medalists in upper right corner having the best PDO values. Czech team was competitive in Corsi For% with second best value of 63.8% (only Sweden was better with 71.3%) but failed to compete in PDO (only 92.8). Sweden recorded the best shooting efficiency (winning 25-0 helps) but it was Finland and Switzerland denying shots on goals on highest rates. Does anyone know some Meiers and Kosonens?
Norway´s PDO looked very solid but Norway was on unlucky side in two matches (2-3 overtime quarterfinal loss to Switzerland and 5-6 penalty shots loss to Latvia) and finished seventh. Denmark remained the last from top 8 in both Corsi and PDO.
Following graph tracks PDO for all teams during the whole tournament.

Sweden was a leader in PDO after the group stage (look at after game no. 3 values) and yeah as stated 25-0 win helps. At the end of the tournament it was all Finland, Switzerland and Sweden ending with very similar numbers. Interestingly Finland was the team that was steadily improving its PDO values during the tournament.
Possession with clear path opportunity ends with a goal on 19% occasions
Now we dig into our 15 game possession-based data tracking. There are teams with more games tracked (all games tracked for Czechia) and some with only two (Latvia, Germany, Norway). This is very important for the context in which we try to interpret our data. Next table serves as an overview of all games played for all teams.

*only 50 minutes were tracked in Sweden vs Denmark game due video cut.
Table above summarizes teams according final standings and bringing results of some key metrics. Goals scored for and against, clear paths created for and against and odd man rushes for and against.
What were average numbers at the 2018 WFC?
If we divide possessions into four categories we find out what type of possessions were more and less frequent in games:
60% of slow attack possessions
27% of quick attack possessions
6% of odd man rush possessions
6% of turnover possessions
Dangerous possessions were defined as a sum of odd man rushes and possessions with clear path opportunities. How often were teams able to create them? In the tournament there were:
6% of odd man rush possessions (as we know from the list above)
17% of clear path opportunity possessions (14% from slow attack, 16% from quick attack, 45% from turnover)
Yeah, teams were much likely creating clear path from turnover possessions as almost every second turnover yielded clear path opportunity.
Why are these possessions dangerous?
Simply look at following numbers:
Teams scored on 3% of common possessions (slow attacks, quick attacks or turnovers with no clear path opportunity)
Teams scored on 19% of possessions with clear path opportunity
Teams scored on 11% of odd man rush possessions
This is the reason interest of data analysis at WFC was mainly in dangerous possessions. There were 23% of dangerous possession created (6% odd man rushes and 17% clear paths) and they were responsible for 63% of all even strength goals!
Finland and Sweden with the best odd man rush execution
Next table brings us specifics of all teams. Which team was above average in creating clear paths or goals from different possessions?

Underdogs such as Latvia, Germany or Denmark focused more on odd man rush situation as they were able to yield them on above average rate. It was top 4 teams though that created more clear path opportunities from their attacks. Sweden and Finland led the pack with 21% and 20%. Switzerland was very effective in scoring from clear path opportunities with 27% of successful execution rate. Finland was able to score on 20% of odd man rushes that was the most from all teams followed be Sweden with 18%. Czechia and Norway could not convert much from odd man rush situations. Only 3% of goals were scored from common possessions and Finland followed by Sweden led the pack once again.
Who were the team leaders?
Shifting our focus to players there are four graphs summarizing players from always two team and their dangerous possessions scores is displayed.
We start with Latvia and Norway. There were only two games tracked for both teams and against strong opponents. This should be noted before looking at the graph.
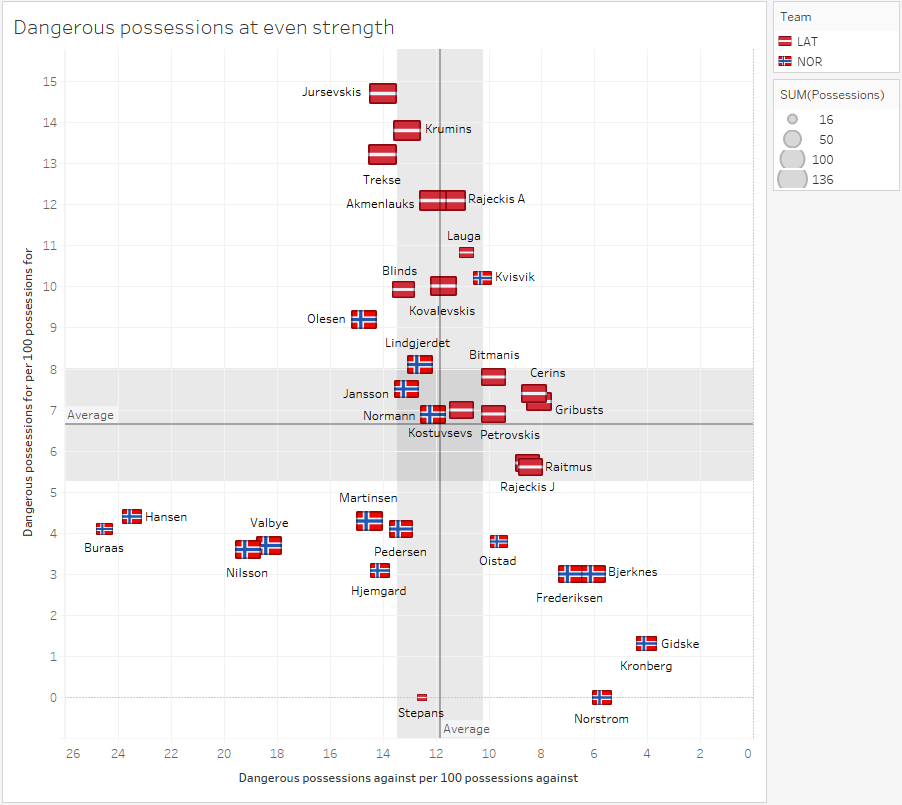
Starting with Latvian team Jursevskis, Krumins and Rajeckis A. recorded positive dangerous possessions differential which is good result from these tough matches. For team Norway Kvisvik had solid numbers followed by Gidske, Kronberg and Bjerknes.
Germany and Denmark is next couple to be visualized. Again only two games tracked for Germany while three for Denmark. All against strong opponents.

Four German players with neutral (same value for dangerous possessions for and against) score. They were Siede, Bottcher, Broker N. and Von Pritzbuer. From Danish team it is Eldholm with the least negative differential followed by Morup.
Switzerland and home country are displayed next. There were more games tracked for them (5 for Swiss and 6 for Czech squads).
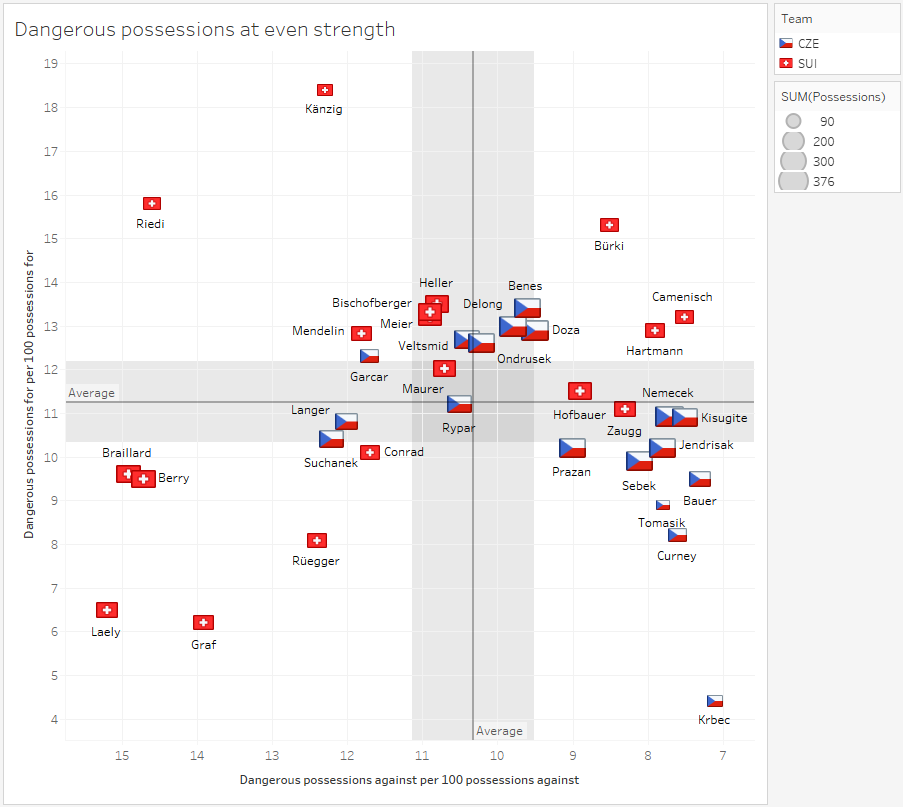
We see smaller flags for Switzerland in the “elite” right upper corner meaning these players played less than other teammates. It was namely Bürki, Camenisch or Hartmann. Zaugg, Heller or Hofbauer were others behind. Benes, Kisugite and Doza was a trio with best results for Czechs followed by Nemecek and Delong.
Sweden and Finland come at last. For both teams there were 5 games tracked at the WFC.

Less minutes and against lesser competition were given to Wilhelmsson, Palmen or Jonsson who took advantage and had the best dangerous possessions differential. Next in line and playing more was Samuelsson J. followed by Ostholm, Samuelsson M., Nilsson and Johansson. Who had the best dangerous possessions results from the winning team? It was Savonen, Johansson S., Salo, Salin and Lamminen who played mostly on the same line. Next were Pylsy, Lastikka and Kivilehto.
WFC dangerous possessions should not serve as ranking of performances of players. It is a display of how successful players were when put in certain context. Quality of teammates, quality of competition and as mentioned lack of some games are still contextual aspects to be added in order to get close to ranking.
Lastly you can browse two sets of data on your own here:
Dangerous possessions of players
Shot attempts and assists for players
Discover yourself who was passing machine and who was shooting beast in the tournament.
By Petr Malina
News
21 - 40 / 146


Latvia Overcomes Norway after Penalty Shootout – 8.12.2018
Data Analysis: Czech Republic vs Denmark 10-1 – 8.12.2018
DAY 8: Battles for Final Start, Quarterfinal Losers to Fight for Fifth Place – 8.12.2018
Day 7 Summary: Favorites Sail through to Semis, Championship Again Offers Fantastic Atmosphere – 8.12.2018
Slovakia Takes 9th Place after Exciting Victory over Estonia – 7.12.2018
Finland Becomes Last Semifinalist after 6-1 Win against Germany – 7.12.2018
Canada Edges out Australia Thanks to Huge Comeback in Third Period – 7.12.2018
Sweden Advances to Semifinals after Beating Latvia – 7.12.2018
Poland Outclasses Thailand 9-1 to Grab 13th Place – 7.12.2018
Takizawa Scores Twice as Japan Beats Singapore 4-2 to Take 15th Place – 7.12.2018
Data Analysis: Group Stage Summary – 7.12.2018
DAY 7: Two Quarterfinals and Final Placement Matches on Schedule – 7.12.2018
Day 6 Summary: Czechs Easily through, Switzerland Stumbles, Attendance Record Broken – 7.12.2018
New WFC Attendance record – 6.12.2018
Data Analysis: Sweden vs Denmark 25-0 – 6.12.2018
Czech Republic Comfortably Wins Over Denmark to Reach Semifinals – 6.12.2018
Estonia Outclasses Canada 9-2 to Face Slovakia in 9th Place Game – 6.12.2018
Switzerland Gets Past Norway in Overtime Drama – 6.12.2018
Slovakia Beats Australia 12-3, Will Fight for 9th Place Tomorrow – 6.12.2018
Data Analysis: Norway vs Finland 1-9 – 6.12.2018